You can find your Artbutler NEXT statistics in the lower section of the dashboard. Below your top showrooms, three analyses are available that help answer important questions at a glance, such as:
Which artists generate the highest revenue for you – and how many artworks are still available on-site?
Which artwork types sell best: paintings, drawings, or sculptures?
What is the value of your investments per artist in sold or available artworks?
Where is the focus of your collection, and does it match your perception?
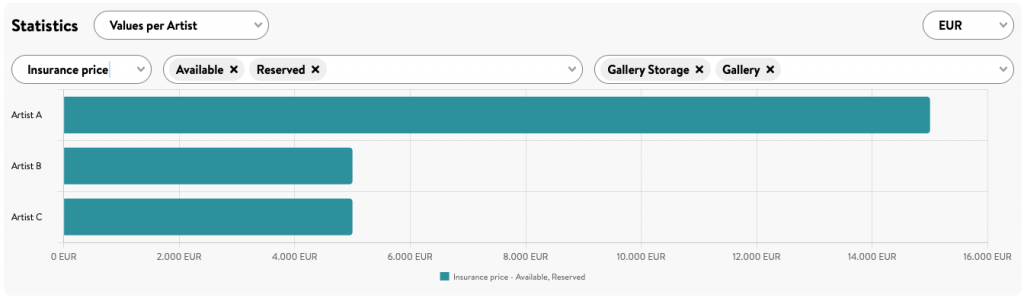
Values per Artist with Status and Location
Find out the total value of artworks you hold in your inventory for each artist. In the first example, the chart displays the insured value of artworks with the status Available or Reserved at the locations Gallery and Storage.
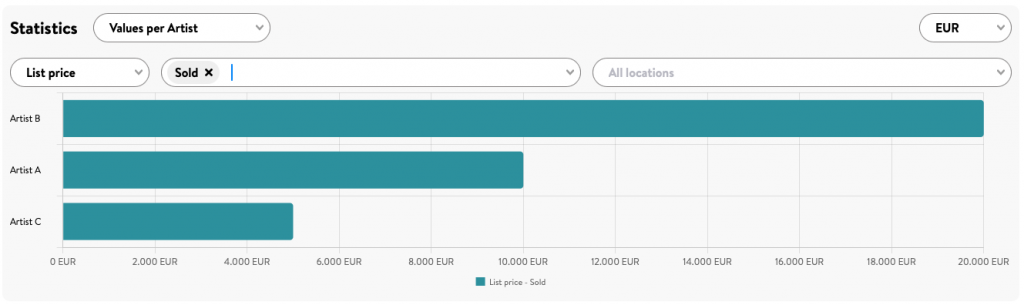
You can also display the total list prices per artist for artworks with the status Sold.
Simply select the price type you want to analyze (Purchase Price, List Price, Insurance Value, or Framing Cost) as well as the artwork statuses and locations to be included in the analysis, and Artbutler NEXT will generate a customized evaluation.
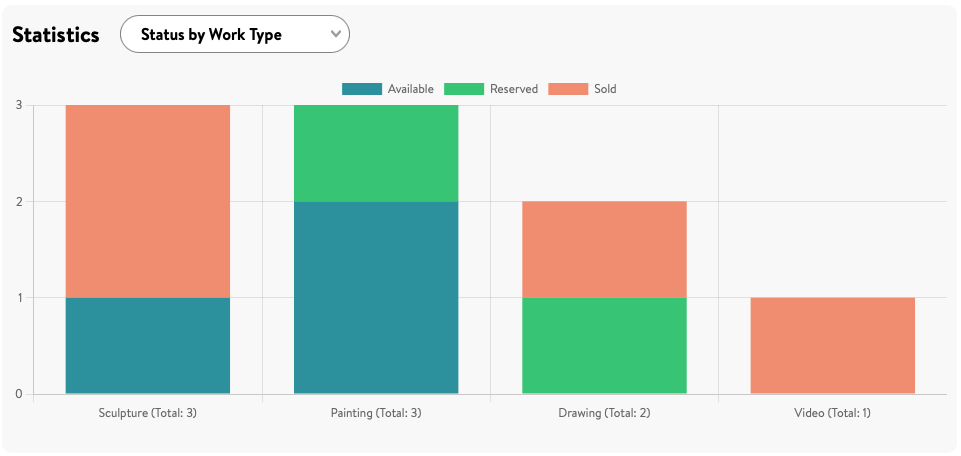
Status by Work Type
Compare the ratio of available and sold works for each artwork type and keep an eye on artworks with the status Reserved as well.
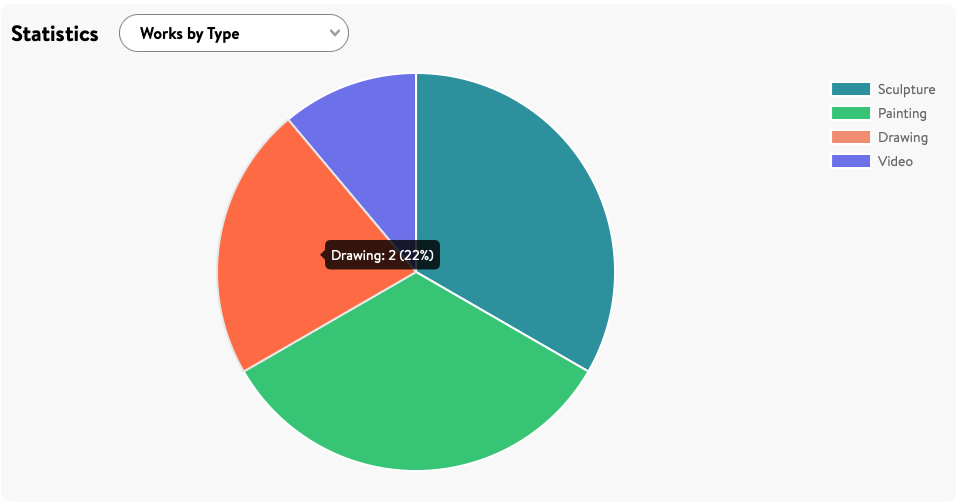
Works by Type
Which artwork types are represented in your collection, and in what proportions? Click on a segment of the pie chart to display the exact number of artworks in that category, such as video works or sculptures.